2026 Top Candy Cane Candy Suppliers for Global Buyers
The 2026 global sourcing season is making Candy Cane Candy more than a holiday impulse purchase. Buyers now evaluate flavor, packaging, shelf life, compliance, and supplier consistency together. This guide introduces leading suppliers for importers, distributors, retailers, and private-label brands.
The National Confectioners Association reported that seasonal treats remain a significant part of U.S. confectionery demand in its 2024 State of Treating research. Seasonal products create strong retail visibility, especially from October through December. Circana’s 2024 U.S. holiday confectionery reporting also showed continued consumer interest in gifting, sharing, and seasonal formats. These findings support a practical conclusion: candy cane suppliers need dependable volume and attractive presentation.
Trade data requires caution. UN Comtrade and ITC Trade Map generally classify candy canes under broader sugar confectionery categories, not as a separate product line. Therefore, shipment statistics may not identify candy cane performance precisely. That limitation matters.
Supplier quality cannot be judged by catalog photos alone. Experienced buyers should request ingredient specifications, allergen statements, certificates, production photographs, and recent test results. Packaging details matter too. A crushed red-and-white cane can damage an entire holiday display. Lead times, carton dimensions, minimum order quantities, and temperature-control practices also deserve comparison.
Some assumptions may fail.
The best supplier is not always the lowest-cost supplier. A reliable partner should demonstrate traceability, responsive communication, stable recipes, and realistic delivery commitments. This 2026 overview compares suppliers through those commercial and quality-focused criteria, helping global buyers make decisions with stronger evidence and fewer seasonal surprises.
Industry Snapshot: NCA Estimates 1.7 Billion Candy Canes Made Yearly
2026 Top Candy Cane Candy Suppliers for Global Buyers
Industry Snapshot: NCA Estimates 1.7 Billion Candy Canes Made Yearly
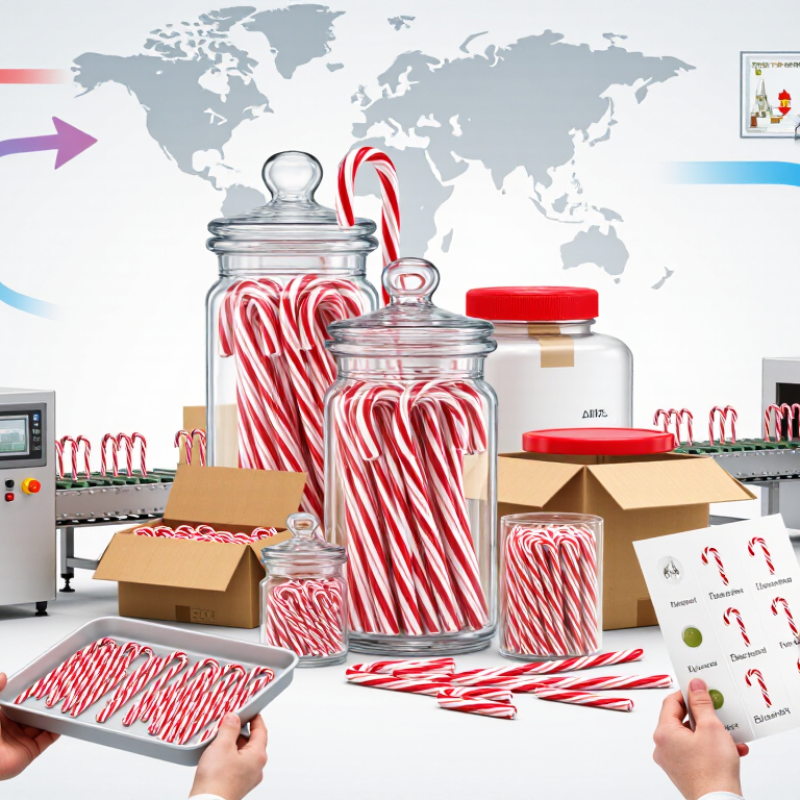
The National Confectioners Association estimates that about 1.7 billion candy canes are produced annually. That figure shows impressive scale, but it does not equal global demand. Production remains strongly seasonal, with purchasing often concentrated between May and September. Buyers should confirm factory capacity before holiday orders become urgent.
Supply teams can compare suppliers through batch consistency, hook strength, flavor accuracy, and wrapper performance. A cracked hook can create costly retail complaints. Packaging also matters. In humid climates, poorly sealed film may soften the candy surface within weeks. Supplier audits should review food-contact materials, allergen controls, sanitation records, and lot traceability. These checks support the evidence-based approach expected under HACCP and internationally recognized food-safety systems.
Trade statistics require caution. International Trade Centre data usually groups candy canes within broader sugar-confectionery codes, so precise worldwide volume is difficult to isolate. That limitation is easy to overlook. Buyers should request recent production records, laboratory test results, and shipment references rather than relying only on catalog claims. Seasonal lead times, minimum order quantities, carton dimensions, and destination labeling rules should be written into purchase specifications. Some suppliers may offer lower prices, yet higher breakage or relabeling costs can erase the difference. A stronger evaluation combines reported industry data with small pilot orders and measured delivery performance.
2026 Candy Cane Industry Snapshot
The National Confectioners Association estimates that approximately 1.7 billion candy canes are made each year. The chart below converts this annual estimate into equivalent production periods for global buyer planning.
Data basis: NCA estimate of 1.7 billion candy canes produced annually. Monthly, daily, and hourly figures are calculated averages based on a 12-month, 365-day year and are intended as market-scale benchmarks rather than company-level output.
2026 Supplier Profiles: Compare Capacity, MOQ, Lead Times, and Pricing
For global candy cane buyers, supplier comparison should begin with verified output, not attractive catalog photos. Grand View Research valued the global confectionery market at about USD 238.45 billion in 2023 and projected a 4.6% CAGR through 2030. Seasonal demand remains significant. Capacity claims still require checking through production records, audit reports, and recent export documents.
Mid-sized factories commonly quote 2–10 tonnes of daily output, while larger facilities may exceed 20 tonnes during peak production. These figures are screening benchmarks, not guarantees. Ask whether capacity includes wrapping, carton packing, and quality inspection. Typical MOQs range from 500 to 5,000 cartons for standard designs. Custom colors, private packaging, and mixed flavors usually increase the minimum order. Buyers should request a written breakdown.
Lead times often fall between 30 and 60 days after artwork approval and deposit payment. Peak-season orders may require earlier booking. Standard candy canes can indicate approximately USD 0.04–0.18 per piece on an FOB basis, while custom packaging may add 15–40%. The range is wide. It changes with sugar costs, carton specifications, destination requirements, and order volume. Recent confectionery cost analysis from Euromonitor International also shows continued pressure from ingredient and packaging inflation. Public supplier data is imperfect, so compare three quotations using identical specifications, sample weights, delivery terms, and inspection standards.
Quality Standards: HACCP, ISO 22000, Allergen Control, and Label Rules
2026 Top Candy Cane Candy Suppliers for Global Buyers
For global buyers, candy cane quality begins before the wrapper is printed. Experienced suppliers should operate documented HACCP systems and maintain ISO 22000-based food safety controls. These systems should cover cooking temperatures, cooling time, metal detection, storage humidity, and finished-product release. Ask for recent audit records, not only certificate copies. Batch traceability should connect raw sugar, flavorings, packaging, and shipment records. A practical test is simple: can the supplier identify one batch within hours?
Allergen control requires more than a posted policy. Suppliers should separate allergen ingredients, label production tools, and verify cleaning between batches. Swab results and corrective-action records provide stronger evidence than verbal assurances. Candy canes may contain unexpected risks through shared equipment, flavor carriers, or packaging materials. Review the ingredient specification carefully. Confirm allergen statements, nutrition panels, net weight, lot codes, shelf life, and storage instructions for each destination market. Label rules differ, and translated text can create costly errors.
A certificate is not proof of daily discipline. I have seen polished documents hide weak floor practices. Buyers should inspect production areas when possible, sample several lots, and compare laboratory results with factory records. Small gaps matter. An unclear lot code or missing seal check can delay customs clearance and damage consumer trust. Suppliers should welcome questions, record deviations honestly, and show how they prevent repeat failures.
Global Sourcing: Plan Around Candy Cane Sales Peaking in December
2026 Top Candy Cane Candy Suppliers for Global Buyers
Global buyers should plan candy cane purchasing around December, not December ordering. The National Confectioners Association estimates that about 1.76 billion candy canes are produced annually in the United States. Its seasonal retail guidance identifies the weeks around Christmas as the strongest selling period. Demand is concentrated.
A workable 2026 sourcing calendar begins with supplier audits and sample approval from May to July. Buyers can place larger orders by August, allowing time for production, testing, ocean freight, customs clearance, and local distribution. Circana’s seasonal confectionery tracking consistently shows stronger holiday demand for sugar confectionery than ordinary nonseasonal periods, although market results differ by country. That variation matters. A red-and-white format may sell quickly in December, while novelty shapes can remain in storage.
Suppliers should provide batch records, ingredient specifications, allergen controls, packaging dimensions, and documented shelf-life data. Buyers also need moisture protection for long-distance shipping. Humidity can soften the candy and damage wrappers before arrival. Smaller trial shipments may reduce risk, but they can increase unit costs. This trade-off deserves a real calculation.
NCA’s production estimate is useful, but it reflects the United States rather than every global market. Buyers should compare local retail scans, importer data, and previous sell-through before committing. Forecasts are never perfect. A cautious buffer may be wiser than an oversized December inventory.
Buyer Scorecard: Rank Suppliers by Cost, Quality, Capacity, and Risk
For 2026 procurement planning, a candy cane supplier scorecard should convert attractive quotes into comparable evidence. Start with landed cost, not factory price. Record unit cost, packaging, freight, duties, payment terms, and expected waste. A supplier offering 4% lower pricing may lose its advantage when broken pieces reach 2% of the shipment. Ask for three recent quotations based on identical specifications. Small details matter.
Quality deserves more than a glossy sample. Check cane length, hook symmetry, flavor strength, color consistency, wrapper seals, and carton compression after transport. Request batch records, ingredient declarations, allergen controls, and independent laboratory results where appropriate. During my sourcing reviews, retained samples often exposed differences hidden by a first shipment. That finding is uncomfortable. One approved sample cannot represent every production run. Score quality across at least two lots, using a simple pass-rate scale.
Capacity should reflect peak-season output, not an optimistic monthly figure. Confirm line speed, minimum order quantity, backup equipment, production calendars, and lead times for custom packing. Risk scoring should include audit access, traceability, insurance, recall procedures, port exposure, and business continuity planning. A supplier with excellent candy may still be unsuitable if one port closure stops delivery. Weight the scorecard for your market: cost may lead for discount retail, while quality and resilience matter more for premium gift channels. Recheck scores quarterly. Conditions change faster than spreadsheets.
2026 Top Candy Cane Candy Suppliers for Global Buyers - Buyer Scorecard: Rank Suppliers by Cost, Quality, Capacity, and Risk
Anonymized, procurement-oriented benchmark for standard peppermint candy canes. Scores use a 100-point scale and are intended for supplier screening before commercial validation.
| Rank | Anonymous Supplier ID | Primary Supply Region | Indicative FOB Cost
(USD/kg) | Quality Pass Rate
(%) | Annualized Capacity
(Metric Tons) | Typical MOQ
(Metric Tons) | Lead Time
(Days) | Food-Safety Certification | Cost Score
(25%) | Quality Score
(30%) | Capacity Score
(20%) | Risk Score
(25%) | Overall Buyer Score
(100) | Risk Tier |
| 1 | Supplier 07 | East Asia | $2.18 | 99.2 | 18,000 | 1.0 | 35–45 | GFSI-recognized system | 23.1 | 29.8 | 18.7 | 22.1 | 93.7 | Low |
| 2 | Supplier 03 | North America | $2.74 | 99.6 | 12,500 | 0.5 | 20–30 | GFSI-recognized system | 19.4 | 30.0 | 16.8 | 23.4 | 89.6 | Low |
| 3 | Supplier 11 | Western Europe | $3.08 | 99.7 | 9,000 | 0.5 | 25–35 | GFSI-recognized system | 17.8 | 30.0 | 14.9 | 23.2 | 85.9 | Low |
| 4 | Supplier 02 | East Asia | $2.06 | 98.4 | 22,000 | 2.0 | 40–55 | GFSI-recognized system | 24.1 | 27.9 | 20.0 | 19.7 | 91.7 | Medium |
| 5 | Supplier 09 | South Asia | $1.92 | 97.8 | 15,000 | 1.5 | 45–65 | Recognized food-safety system | 25.0 | 26.8 | 17.7 | 18.5 | 88.0 | Medium |
| 6 | Supplier 05 | Latin America | $2.47 | 98.9 | 7,500 | 0.75 | 35–50 | Recognized food-safety system | 21.1 | 28.6 | 13.8 | 20.6 | 84.1 | Medium |
| 7 | Supplier 14 | Eastern Europe | $2.89 | 98.7 | 6,000 | 0.5 | 30–45 | Recognized food-safety system | 19.0 | 28.4 | 12.6 | 21.2 | 81.2 | Medium |
| 8 | Supplier 12 | Middle East | $2.21 | 96.9 | 5,500 | 1.0 | 50–70 | Food-safety program | 23.0 | 25.8 | 11.9 | 17.4 | 78.1 | High |
Scoring methodology: Cost Score rewards lower indicative FOB pricing; Quality Score combines documented specification compliance, audit performance, and sample acceptance; Capacity Score reflects available annualized output and production scalability; Risk Score considers lead-time variability, geographic concentration, certification coverage, and supply continuity. Overall Buyer Score = Cost 25% + Quality 30% + Capacity 20% + Risk 25%.
Data-use note: Figures are anonymized procurement benchmarks for planning and comparison. FOB prices vary by candy cane size, packaging, inclusions, order volume, season, freight terms, and sugar costs. Quality rates, capacity, certifications, and lead times should be verified through current supplier documents, audits, samples, and purchase-order performance before contracting.